Understanding community response to Warburton MTB project
The Mountain bike park planned for Warburton has been extremely controversial with social and environmental concerns regularly voiced by critics. An Environm...

Uncertainty in 3D geological models is challenging to simulate because the models used to represent geology are generally parameterised by the observations that are used to assess the quality of the mdoel. Geological uncertainty can be split into three components:
A geological model quantifies the subsurface geometries of geological objects. Each geological object (faults, folds, stratigraphy etc) can be represented by an implicit function. The implicit function is an unknown function that represents the pseudo distance to a reference surface of the geological object. For example, this could be the signed distance to the fault surface or the distance to the base of a stratigraphic series. Geological observations describing the location of a geological object e.g. the fault surface, stratigraphic interfaces can be converted into a value representing the distance to the reference surface. For stratigraphy this means using the cummulative thickness for a stratigraphic series to define the value of different interfaces. These constraints and any gradient constraints can be used to approximate the implicit function. There are two approaches for approximating these approaches data supported and discrete. A more detailed post will follow describing the differences between these approaches but for this example we use the discrete impliciti modelling approach implemented in LoopStructural.
map2loop is a geological map deconstruction and augmentation toolkit that has been developed as part of the Loop project. map2loop allows the geologist to build a geological model by selecting a region (within specific areas) and extracting and generating the required datasets for geological mapping. One of the outputs of map2loop is a local estimation of the unit thickness for each stratigraphic unit. Where stratigraphic thicknesses can’t be guessed map2loop uses the median of all thickness estimates for this package.
LoopStructural can convert map2loop output into an input dataset. LoopStructural needs a global estimation of the unit thickness to define the function value for each interface. The default behaviour is to use the median vaue as this generally avoids outliers and will be representative of the unit thicknesses.
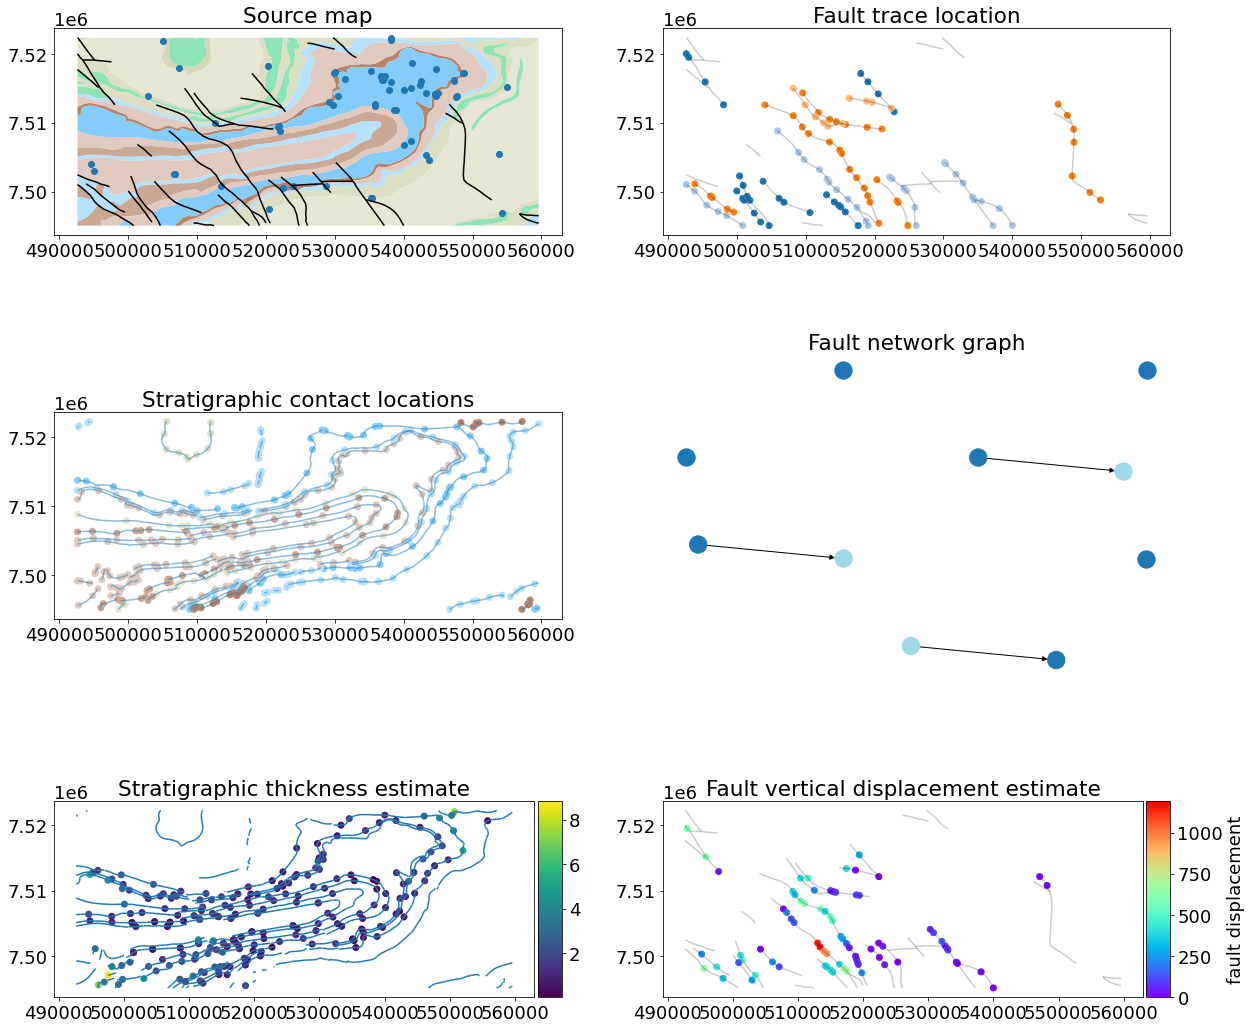
To make this post possible, I have added a thickness probability flag to the from_map2loop_directory function in LoopStructural. This uses the estimated thickness median and the standard deviation (only availabe where the thickness is estimated) as the mean and standard deviation of a normal distribution. The thickness that is used is drawn from this random distribution. 100 model realisations were built using LoopStructural for a study area from the Hamersley Region in Western Australia and the code for running the model simulation is shown below.
thickness_store = [] # container to store the dictionary containing the thickness used
N = 100 # number of models
for i in range(N):
    model, m2l_data = GeologicalModel.from_map2loop_directory('./test2',
                                                                  evaluate=False,
                                                              fault_params=fault_params,
                                                              rescale=False,
                                                              foliation_params=foliation_params,
                                                             m2lflags={'thickness_probabilities':True})
    thickness_store.append(m2l_data['thickness'])
    model.update()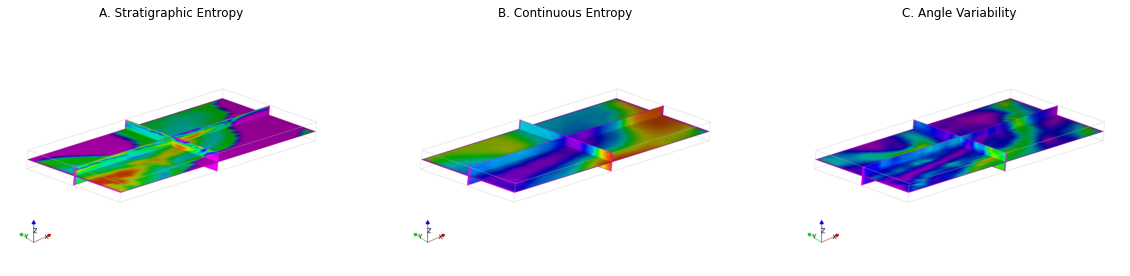
model.to_file('thickness/model_{:03d}'.format(i))Information entropy is commonly used as a metric for quantifying the variability between geological models. The information entropy can be calculated for every location in the model by:
Another approach for quantifying the uncertainty within a suite of geological models is to evaluate the angle variability. The angle variability is the standard deviation of a population of vectors and is calculated by finding the average distance to the mean vector of the population.
The results show that changing the thickness used for the model parameters does impact the resulting 3D model variability. This can be seen in all three of the uncertainty metrics we have chosen to use. The uncertainty metrics all appear to highlight a similar geometry which indicates that the uncertainty variations are localised. The angle variability highlights areas where the model suites have high variation in orientation. These locations usually correspond to the fold hinges.
To further analyse the results the variability of individual stratigraphic units throughout the model suites provide some insight. In the figure below the probability of each lithology occuring at a location is shown alongside a histogram showing the thickness values used for that lithology within the model suite.
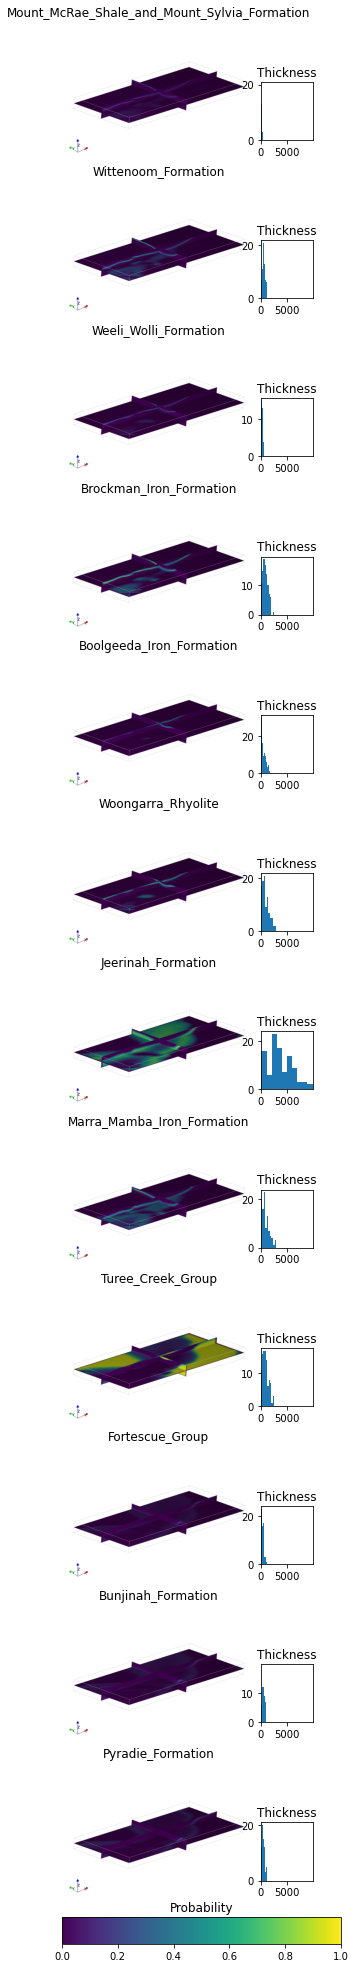
The Jeerinah Formation has a very large range of thicknesses used within the model suite. This results in the unit probabilities being lower with a broad shape, indicating it is more variable across the model suite. The Fortesgue group also shows a broad probability region but this has a high probability highlighting that all models consistently show this unit. This is because the Fortescue group has a large outcropping area.
Thickness estimates are important constraints on the subsurface geometry and taking a different interpetation of the thickness can significantly change the resulting geometries. The results of this experiment are not unexpected the thickness of the units is directly used to constrain the value of the implicit function. The location of the values constraints for the implicit function don’t change so the thickness value effectively changes the apparent thickness on the map.
Going back to the different types of uncertainty, this approach for simulating geological uncertainty allows for the second type of uncertainty (inherent randomness) to be simulated in a geologically meaningful way.
The Mountain bike park planned for Warburton has been extremely controversial with social and environmental concerns regularly voiced by critics. An Environm...
Triangular meshes can be used for representing surfaces in 3D, can be used for interpolation and other modelling. You can extract a triangular mesh using mar...
LoopStructural is the open source 3D geological modelling library that is the 3D modelling module of the Loop project. The code has been written in an objec...
We recently submitted another paper to the Loop3D special issue in Geoscientific Model Development. The paper is currently in discussion phase of the peer re...
The most recent version of LoopStructural addresses some minor bugs and adds a few small improvements for visualisation. The major changes are: Faults add...
Uncertainty in 3D geological models is challenging to simulate because the models used to represent geology are generally parameterised by the observations t...